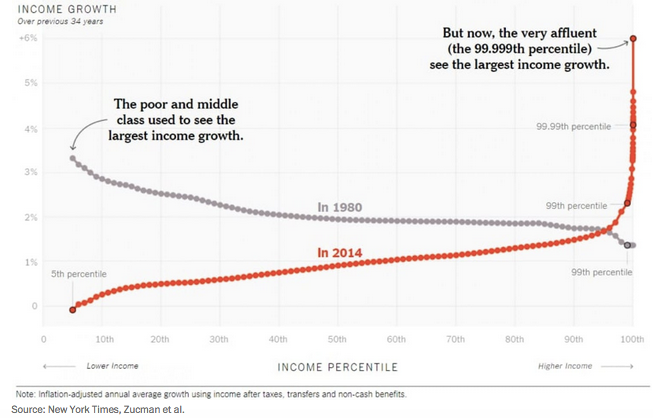
The growth pattern over the second 34-year period looks very different: The richer you were, the faster you got ahead. Incomes grew less than 1 percent for the bottom 50 percent and less than 2 percent for the next 45 percent. They then took off for the richest Americans, with the growth rate for the richest adults ending up about six times that of those in the middle.
The chart is a clear, intuitive way to show the increase in income inequality over the past few decades, and an important reminder that growth for the rich cannot be expected to trickle down to everyone else.
But it doesn’t show why inequality has grown. What explains this portentous change, one that has had profound effects on our society, our living standards, and our politics?
In fact, there are many perps, each of which is captured in the “Inequality’s Causes” slide below. They do, however, share a theme: Many of the factors that enforced a more equitable distribution of growth in the earlier period have been eroded. Moreover, that erosion is neither an accident nor the benign outcome of natural economic evolution. It is often the result of policies that have reduced workers’ bargaining power and supported the upward redistribution of growth.