WHAT DATA DO ECONOMISTS USE TO ANALYZE THE US ECONOMY?
There is so much information about the economy everywhere and few us us have any background or education in either micro or macro economics. How are we to make sense of our economy or be able to know when we are being misled? How to decide what we think, who to support, which economic plans to endorse?
Without studying or becoming economists, the following course of action should get all of us to the point where we can identify a good economic plan and a bad one, following a tried and true approach “keep it simple!”
- Understand out current economy as it is today based on data. Do not believe it when you are told that the economy is different from the underlying data.
- Focus on data presented in graphs and brief explanations only
- Understand that economic policies and decision time to take effect. The results of decisions made, and actions taken, today will not be obvious for years. This is why analyzing trends and history is so essential in understanding our economy. Follow trends over time on this website, use data and do not be swayed by impossible predictions or claims. For example, many will say that the US economy could grow at 4-6% if there were tax cuts for the wealthy. This is nonsense. We are in a very different economy and political atmosphere than we were in during the Reagan tax cuts. During that era, we had bi-partisanship and politicians knew better how to work together and negotiate so we got the value of spirited debate and compromise. Now we have corrosive divideness that leads to extremely poor decision making for the American people. See
- Read Paul Krugman’s opinion column in the New York Times or subscribe to his blog as an excellent way to be able to understand economic events and how they intersect with politics. His columns are always filled with data points from reputable sources that are linked so you can access and read.
Below is an excellent example of an article from FiveThirtyEight, for the time period studied, that explains the US recovery from the Great Recession from 2008 through 2014. The period of recession is from 2008 through 2009. The official end date of the recession was mid-2009. Even though this was four or six years ago, the article accomplishes the following:
- Shows us what economic data to look at to do an analysis, what kinds of information to track over time
- Shows us that what we might perceive by just experiencing our own economic situation does not necessarily reflect what everyone in the nation is experiencing
- Shows us the seeds of the problems that we are experience today, in 2017, why so many people in the US are angry and have not experienced recovery
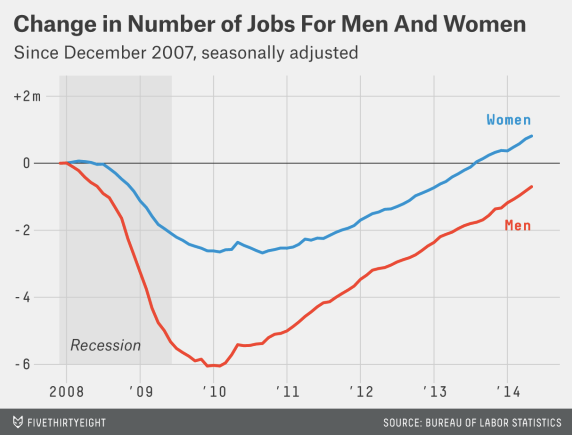
- women have recovered better than men
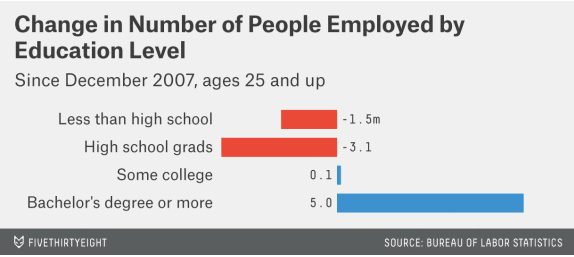
- educated people have recovered better than those without a college education
- younger people had a more difficult time rebounding
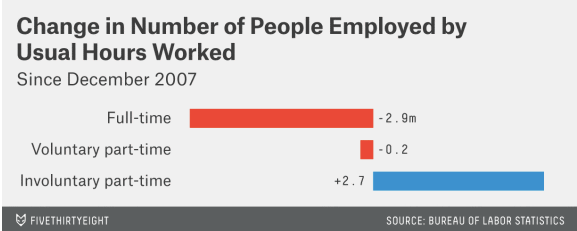
- more people found part time work
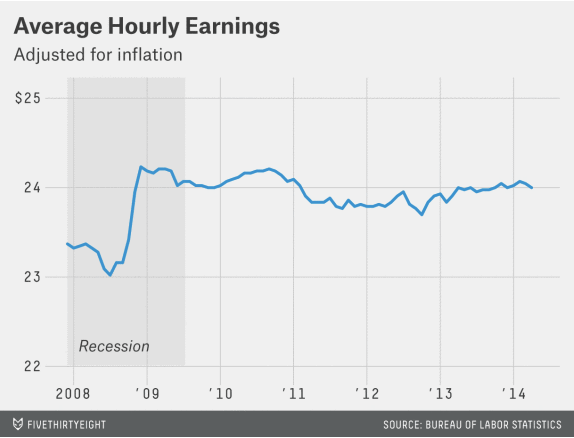
- average hourly rate rebounded but have not grown
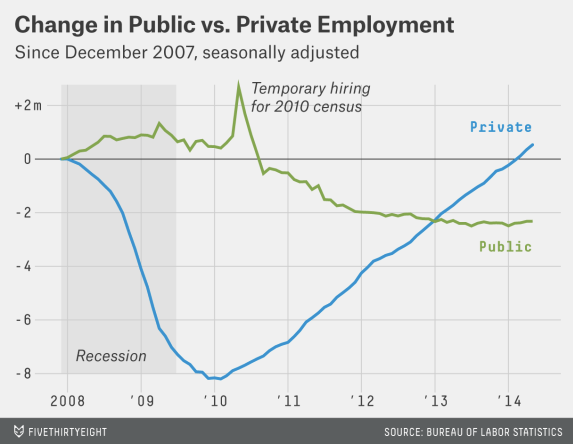
- private sector employment has grown to pre-recession levels while public sector employment has not
How to Analyze the US Job Market’s Five-Year Recovery in 10 Charts
Jun. 6, 2014 at 10:27 AM
Six-and-a-half years after the Great Recession began — and five years after it officially ended — the U.S. has finally surpassed its pre-crisis employment peak. But the job market is far from fully healed.
U.S. employers added 217,000 jobs in May, bringing total non-farm employment to 138.5 million — 113,000 more than the 138.4 million jobs that existed in December 2007, the first month of the recession. It took 76 months to regain the nearly 9 million jobs lost in the recession, making this by far the slowest jobs recovery since World War II.1 (If any of this sounds familiar, you’re right: Private-sector employment returned to its pre-recession peak in March.)
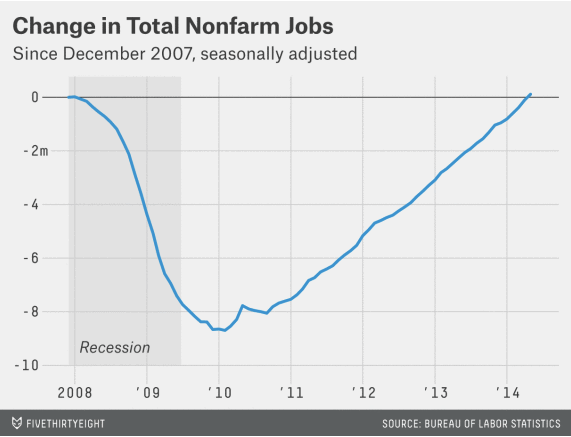
Getting back to square one isn’t much to celebrate, however. There are more than 6 million more working-age Americans2 today than when the recession began. Adjusting for population growth, we’re still millions of jobs short of where we were 6½ years ago — and have seen hardly any jobs recovery.3
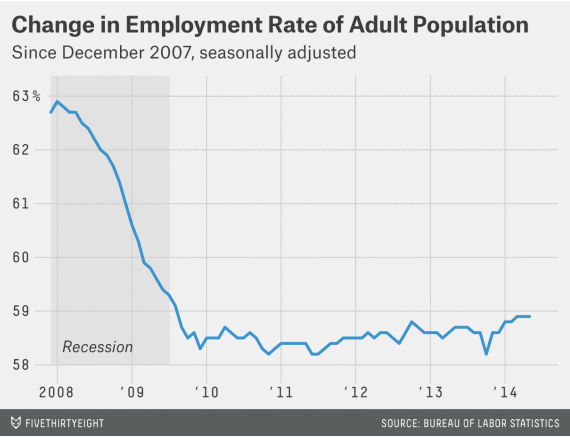
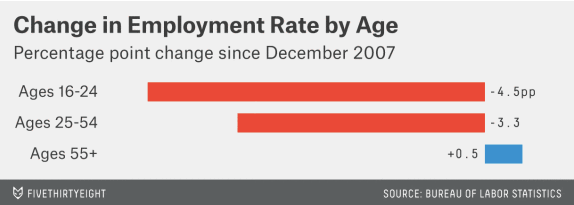
That chart makes things look worse than they are. The aging of the population would have pushed down the overall employment rate even without the recession. But even controlling for demographics, the trend has been grim. Young people have been hit especially hard, but so-call prime-age workers — those between ages 25 and 54 — have also seen a big drop in their rate of employment since the recession began. Older workers, meanwhile, have held onto jobs.4
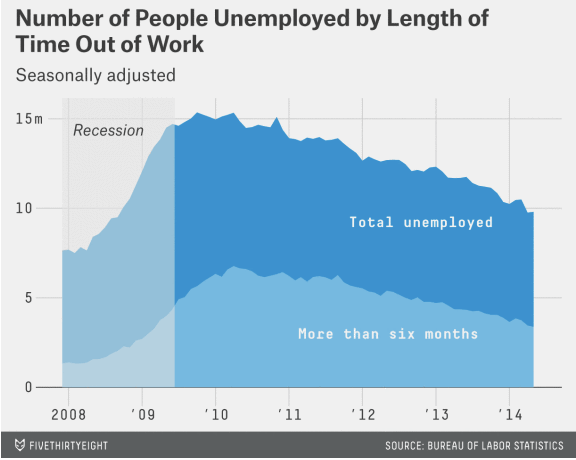
Moreover, while employment has, at last, returned to precrisis levels, unemployment isn’t even close. There are still nearly 10 million unemployed workers in the U.S., more than a third of whom have been out of work for more than six months. The good news is that the ranks of the unemployed are no longer growing: Layoffs are back to normal, and short-term unemployment has returned to its prerecession level. But long-term unemployment remains a crisis: There are 2 million more long-term jobseekers today than when the recession began. What’s worse, their prospects have hardly improved in the recovery: Barely one in 10 find jobs each month, and few of those jobs prove stable.
The recession and slow recovery have been harder on some groups than on others. Women fared better than men in terms of employment, in part because they were less likely to work in sectors such as construction and manufacturing that were particularly hard-hit in the downturn. Men have experienced a stronger rebound in the recovery, but only slightly. As a result, women returned to prerecession levels of employment last summer, while men remain hundreds of thousands of jobs in the hole.
Similarly, better-educated workers were less likely to lose their jobs in the recession and have regained them more quickly in the recovery. In fact, the least-educated workers didn’t even start regaining jobs until late 2012.5
Even those who do find jobs aren’t necessarily finding good ones. More than 7 million Americans are stuck in part-time jobs because they can’t find full-time work. Part-time employment has trended down in the recovery: Over the past year, full-time employment is up by 2.4 million, and part-time employment is down by 500,000. But part-time employment remains elevated by historical standards.
Earnings, meanwhile, have been stagnant. In fact, after adjusting for inflation, average hourly wages are lower now than when the recession ended. Weekly wages haven’t done much better, in part because companies aren’t increasing employees’ hours.6
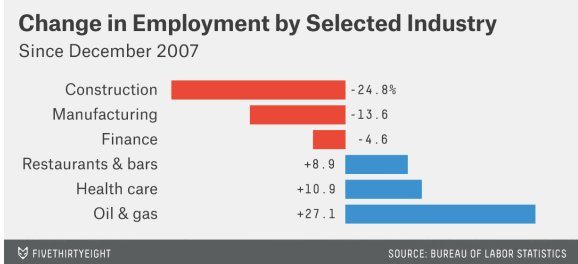
One reason that wages and hours have been so slow to rebound is that many of the jobs that have been added in recent years have been in industries like retail and food-service, which employ lots of part-timers and low-wage workers. Meanwhile, industries that provide middle-class jobs, such as construction and manufacturing, have been slow to recover. There are exceptions. Health care has been a consistent driver of job growth in both the recession and recovery. The oil and gas sector has seen huge gains due to the fracking boom, although it makes up only a tiny fraction of overall employment.
One reason the recovery has been so weak is that the government, which added jobs in the recession, cut them during the recovery, even as the private sector was struggling to gain momentum. The private sector has added nearly 200,000 jobs per month on average over the past three years, but the government has cut more than 7,000 jobs per month over the same period.
Ben Casselman is a senior editor and the chief economics writer for FiveThirtyEight. @bencasselman
