Rooster Today
2016 UPDATE – EDUCATION IN AMERICA
NATIONAL CENTER FOR EDUCATION STATISTICS Fast Facts
Elementary and Secondary Education
Enrollment
In fall 2016, about 50.4 million students will attend public elementary and secondary schools. Of these, 35.4 million will be in prekindergarten through grade 8 and 15.0 million will be in grades 9 through 12. An additional 5.2 million students are expected to attend private elementary and secondary schools (source). The fall 2016 public school enrollment is expected to be slightly higher than the 50.3 million enrolled in fall 2015.
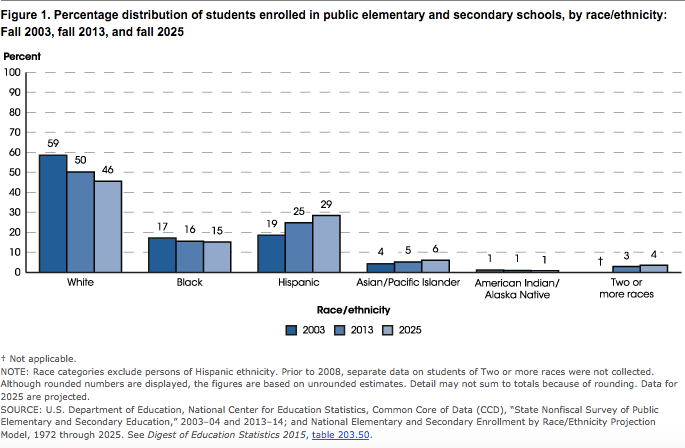
Of the projected 50.4 million public school students entering prekindergarten through grade 12 in fall 2016, White students will account for 24.6 million. The remaining 25.9 million will be composed of 7.8 million Black students, 13.3 million Hispanic students, 2.7 million Asian/Pacific Islander students, 0.5 million American Indian/Alaska Native students, and 1.5 million students of Two or more races (source). The percentage of students enrolled in public schools who are White is projected to continue to decline through at least fall 2025, as the enrollments of Hispanic students and Asian/Pacific Islander students increase (source).
 In fall 2016, about 1.3
 million children are expected to attend public prekindergarten; enrollment in public kindergarten is projected to reach approximately 3.7 million students (source).
About 4.0 million public school students are expected to enroll in 9th grade in fall 2016. Students typically enter American high schools in 9th grade (source).
Teachers
Public school systems will employ about 3.1 million full-time-equivalent (FTE) teachers in fall 2016, such that the number of pupils per FTE teacher—that is, the pupil/teacher ratio—will be 16.1. This ratio is not measurably different from the 2000 ratio of 16.0. A projected 0.4 million FTE teachers will be working in private schools this fall, resulting in an estimated pupil/teacher ratio of 12.2, which is lower than the 2000 ratio of 14.5 (source).
Schools and Districts
In 2013–14, there were nearly 13,500 public school districts (source) with close to 98,300 public schools, including about 6,500 charter schools (source). In fall 2013, there were about 33,600 private schools offering kindergarten or higher grades (source).
Expenditures
Current expenditures for public elementary and secondary schools are projected to be $584.4 billion for the 2016–17 school year. These expenditures instruction, support services, food services, and enterprise operations. The current expenditure per student is projected at $11,600 for the 2016–17 school year (source).
Attainment
About 3.5 million students are expected to graduate from high school in 2016–17, including 3.2 million students from public high schools and 0.3 million students from private high schools (source).
The percentage of high school dropouts among 16- through 24-year-olds declined from 10.9 percent in 2000 to 6.5 percent in 2014 (source). Reflecting the overall decline in the dropout rate between 2000 and 2014, the rates also declined for Whites, Blacks, and Hispanics (source).
The percentage of students enrolling in college in the fall immediately following high school completion was 68.4 percent in 2014 (source).
College and University Education
Enrollment
In fall 2016, some 20.5 million students are expected to attend American colleges and universities, constituting an increase of about 5.2 million since fall 2000 (source).
Females are expected to account for the majority of college students: about 11.7 million females will attend in fall 2016, compared with 8.8 million males. Also, more students are expected to attend full time than part time (an estimated 12.7 million, compared with about 7.9 million) (source).
About 7.2 million students will attend 2-year institutions and 13.3 million will attend 4-year institutions in fall 2016. Some 17.5 million students are expected to enroll in undergraduate programs and about 3.0 million will enroll in postbaccalaureate programs (source).
Increases in the traditional college-age population and rising enrollment rates have contributed to the increase in college enrollment. Between 2000 and 2014, the 18- to 24-year-old population rose from approximately 27.3 million to nearly 31.5 million (source). The percentage of 18- to 24-year-olds enrolled in college also was higher in 2014 (40.0 percent) than in 2000 (35.5 percent) (source).
In 2014, there were about 12.0 million college students under age 25 and 8.2 million students 25 years old and over. The numbers of younger and older students increased between 2000 and 2014 (source).
Increasing numbers and percentages of Black and Hispanic students are attending college. Between 2000 and 2014, the percentage of college students who were Black rose from 11.7 to 14.5 percent, and the percentage of students who were Hispanic rose from 9.9 to 16.5 percent (source). Also, the percentage of Hispanic 18- to 24-year-olds enrolled in college increased from 21.7 percent in 2000 to 34.7 percent in 2014; the percentage of Black 18- to 24-year-olds enrolled did not change measurably during this period (source).
Finance
For the 2014–15 academic year, the average annual price for undergraduate tuition, fees, room, and board was $16,188 at public institutions, $41,970 at private nonprofit institutions, and $23,372 at private for-profit institutions. Charges for tuition and required fees averaged $6,371 at public institutions, $30,643 at private nonprofit institutions, and $13,971 at private for-profit institutions (source).
Attainment
During the 2016–17 school year, colleges and universities are expected to award 1,018,000 associate’s degrees; 1.9 million bachelor’s degrees; 798,000 master’s degrees; and 181,000 doctor’s degrees (source). In 2013–14, postsecondary institutions awarded 96,900 certificates below the associate’s degree level, 1.0 million associate’s degrees, 1.9 million bachelor’s degrees, 754,000 master’s degrees, and 178,000 doctor’s degrees (source).
In 2014, about 73.5 percent of 25- to 34-year-olds with a bachelor’s or higher degree in the labor force had year-round, full-time jobs, compared with 65.8 percent of those with an associate’s degree, 61.6 percent of those with some college education, 65.3 percent of high school completers, and 55.1 percent of those without a high school diploma or its equivalent (source). In 2015, the unemployment rate for young adults with at least a bachelor’s degree was lower than the rate for young adults with some college (2 vs. 6 percent), and the unemployment rate for young adults with some college was lower than the rate for those who had completed high school (9 percent) (source).
In 2014, for young adults ages 25–34 who worked full time, year round, higher educational attainment was associated with higher median earnings; this pattern was consistent from 2000 through 2014. For example, in 2014 the median earnings of young adults with a bachelor’s degree ($49,900) were 66 percent higher than the median earnings of young adult high school completers ($30,000). The median earnings of young adult high school completers were 20 percent higher than the median earnings of those without a high school credential ($25,000). In addition, median earnings of young adults with a master’s or higher degree were $59,100 in 2014, some 18 percent higher than the median earnings of young adults with a bachelor’s degree (source).
For more information, please see the following:
- The Condition of Education: The annual report to Congress on important developments and trends in U.S. education.
- The Digest of Education Statistics: A compilation of statistical information covering the broad field of American education from prekindergarten through graduate school.
- State-level data resource page: Links to selected publications and websites that provide state-by-state information on achievement, attainment, demographics, enrollment, finances, and teachers at the elementary, secondary, and postsecondary levels.
- Projections of Education Statistics: This report provides projections for key education statistics, including enrollment, graduates, teachers, and expenditures in elementary and secondary schools.
- U.S. Department of Education program and budget information can be found here.
- U.S. Census Bureau Current Population Survey: The Current Population Survey (CPS) is a monthly survey of about 60,000 households conducted by the U.S. Census Bureau. The CPS is the primary source of information on labor force statistics and also contains information on enrollment and educational attainment.