HOW ARE WE EDUCATING THE FUTURE OF OUR COUNTRY – OUR STUDENTS
Updated March 2020
American student achievement results are in for 2019. Both NAEP scores (America’s Report Card) and PISA scores (International comparisons) show either a drop or stay the same. This is very bad news. Both results are posts within the Education articles.
DeVos has spent her time supporting for-profit schools, fighting student debt relief and promoting vouchers for private schools. The Christian right has been enormously influential with this president and has been able to gain a lot of ground, particularly with abortion, healthcare and religious freedom for Christians. DeVos has likely been instrumental in promoting this agenda.
The Supreme Court is also providing conservative decisions on many topics and showing very little respect for previous decisions. One important school-related issue is allowing tax money to support vouchers which in turn supports religious schools. Anther issue is to enable discrimination against others who do not hold the same religious viewpoint. While they mean Christian, one can only imagine that this would also apply to Jewish schools, Islamic schools, Bhuddist schools and every other type of “religion”.
=========================================================
Why is is to important today that we educate our students, the future workforce? It has always been imperative that a country provide an education for it’s children, in order to prosper. But now, from an economic perspective, it is also of the utmost urgency. Two major trends, globalization and technology, are major influences, we are in a period of rapid change and the American workforce needs to be educated to remain competitive.
The current president campaigned on a promise to get rid of the Common Core, alleging that the Common Core was an Obama administration sponsored program of standards. The current president also voiced views that education in the country is bad, there is too much government, too much regulation and not enough local control – all aligned with the general conservative narrative. The major options for improvement, put forth by conservatives, are providing additional “choice” to parents via vouchers and injecting competition into the education industry. Generally, these are political solutions to education problems, a red flag. There is scant, to no, evidence or research, that these are effective strategies. We would be wise to focus on proven education solutions first before finding political solutions.
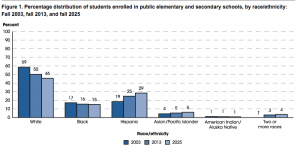
Education is one of the largest industries in the US spending over 584 billion annually for K-12 and over 620 billion when higher education is included. There are approximately 50 million students in public school and over 5 million in private school. There are over 13,500 public school districts and close to 100,000 schools. The composition of the student population is changing.
HOW ARE WE DOING AT EDUCATING OUR STUDENTS
Schools are responsible for meeting many goals, but first and foremost among them is for students to learn reading and math at proficient levels so the student can transition to the next phase of education or work. While there are limits to all assessments, the most widely regarded are National Assessment of Educational Progress (NAEP) for national comparisons and Program for International Student Assessment (PISA) for international assessments.
NAEP is a national assessment, often called the nation’s report card, measuring 4th and 8th grade achievement in math and reading. PISA is the best measurement we have to make international comparison to high performing countries in both math and reading such as Singapore, Malaysia, South Korea, and Finland. None of the highest performing countries have charter schools, online schools or vouchers, nor are they recommended as a key strategy to becoming high performing. Instead the high performing countries provide an excellent education for teachers, ensure that they are well prepared in their content field and regard teaching as a well paid and well respected profession. They also use a national curriculum, national standards and rely on standardized assessment.
After years of collecting international data, we can identify trends and know that American schools are not doing more poorly than they have done in past years. Instead, other countries have made significant improvement in their ability to educate their students, surpassing the US. It is now known that other countries educate all of their students, they do not just educate an elite group. It is also now known that students in other countries experience significant poverty levels, just as it is true in the US.
WHAT NAEP TELLS US
The international findings are independently verified by looking at the trend in NAEP scores, the nations report card. Students in the US have shown modest improvement over from 2003 to 2015 but scores are on the decline from 2013 to 2015. See results of the 2016 NAEP scores in Math and Reading at the 4th and 8th grades by state. Education Week is the leading publication regarding education news and publishes an annual report called Quality Counts. Quality Counts publishes a graded, ranked listing of how states are performing. Many of the measures are of inputs – family income or education for example, or process measures such as the level of financial support or available of preschool and kindergarten. See full report.
Education Week created a comprehensive, combined math and reading “proficient score” in order to make the achievement data more meaningful. The graph below indicates that as of 2015, 34.5 % of US students in grades 4 and 8 meet a proficient level. And of course, this also means that 62.5 % of students do not score in the proficient range. These averages mask wide variations across states and within states so it is necessary to dive deeper to truly understand the data. While the focus on growth and progress is important, it is also important to understand that approximately only 1/3 of US students are considered proficient on the NAEP assessment.
| ACHIEVEMENT | ||
| RANK | SCORE | STATE |
| 1 | 85.2 | MASSACHUSETTS |
| 2 | 81.0 | NEW JERSEY |
| 3 | 79.4 | NEW HAMPSHIRE |
| 4 | 78.8 | VERMONT |
| 5 | 76.8 | MARYLAND |
| 6 | 75.9 | MINNESOTA |
| 7 | 75.8 | VIRGINIA |
| 8 | 75.3 | INDIANA |
| 9 | 74.6 | WISCONSIN |
| 10 | 74.6 | PENNSYLVANIA |
| 11 | 73.9 | FLORIDA |
| 12 | 73.3 | CONNECTICUT |
| 13 | 73.2 | UTAH |
| 14 | 73.2 | WASHINGTON |
| 15 | 72.4 | MAINE |
| 16 | 72.3 | KENTUCKY |
| 17 | 72.0 | TENNESSEE |
| 18 | 71.8 | COLORADO |
| 19 | 71.6 | NEBRASKA |
| 20 | 71.6 | NEBRASKA |
| 21 | 71.2 | WYOMING |
| 22 | 71.2 | GEORGIA |
| 23 | 71.2 | ILLINOIS |
| 24 | 71.0 | RHODE ISLAND |
| 25 | 70.9 | TEXAS |
| 26 | 70.7 | OHIO |
| 27 | 70.7 | ARIZONA |
| 28 | 70.6 | NEW YORK |
| 29 | 70.5 | MONTANA |
| 30 | 70.3 | IOWA |
| 31 | 69.3 | CALIFORNIA |
| 32 | 69.2 | IDAHO |
| 33 | 69.0 | OREGON |
| 34 | 69.0 | HAWAII |
| 35 | 68.1 | NORTH DAKOTA |
| 36 | 67.9 | DELAWARE |
| 37 | 67.6 | MISSOURI |
| 38 | 66.2 | NEVADA |
| 39 | 66.1 | OKLAHOMA |
| 40 | 66.0 | KANSAS |
| 41 | 66.0 | ARKANSAS |
| 42 | 65.6 | ALASKA |
| 43 | 65.6 | MICHIGAN |
| 44 | 65.2 | SOUTH DAKOTA |
| 45 | 64.6 | ALABAMA |
| 46 | 64.4 | SOUTH CAROLINA |
| 47 | 63.1 | DC |
| 48 | 62.8 | WEST VIRGINIA |
| 49 | 62.8 | LOUISIANA |
| 50 | 61.8 | NEW MEXICO |
| 51 | 60.0 | MISSISSIPPI |
Nation Sees Achievement Progress
“When viewed over time, scores on NAEP indicate a modest degree of improvement in the nation’s academic achievement. From 2003 to 2015, the combined proficiency rate for 4th and 8th graders in reading and math increased from 29.6 to 34.8 out of 100. Although this long-term pattern signals progress, a 1.2 point decline between 2013 and 2015 makes the future direction of achievement trends more uncertain. At the high school level, the combined proficiency rate for 12th graders climbed from 27.6 in 2005 to 30.3 in 2013, the most recent year of data available.”
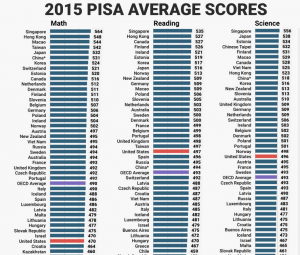
WHAT PISA TELLS US
The United States remains in the middle of the rankings
Among the 35 countries in the OECD, the United States performed around average in science, the major domain of this assessment cycle. Its performance was also around average in reading, but below average in mathematics. There has been no significant change in science and reading performance since the last time they were the major domains (science in 2006 and reading in 2009).
One in five (20%) of 15-year-old students in the United States are low performers, not reaching the PISA baseline Level 2 of science proficiency. This proportion is similar to the OECD average of 21%, but more than twice as high as the proportion of low performers in Estonia, Hong Kong (China), Japan, Macao (China), Singapore and Viet Nam.
At the other end of the performance scale, 9% of students in the United States are top performers, achieving Level 5 or 6, comparable to the average of 8% across the OECD. By contrast, over 15% of 15-year-old students in Japan, Singapore and Chinese Taipei achieve this level of performance. Attitudes towards science are positive overall.