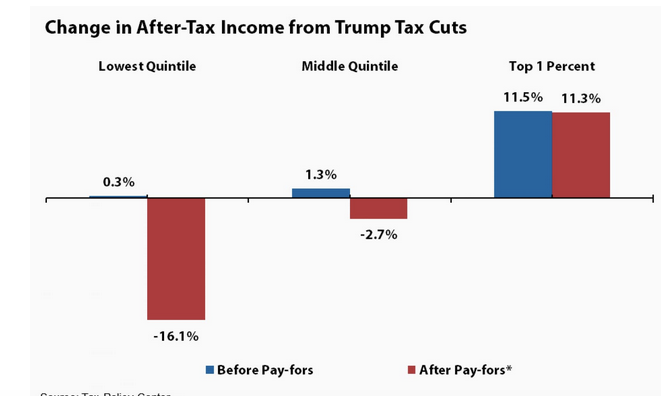
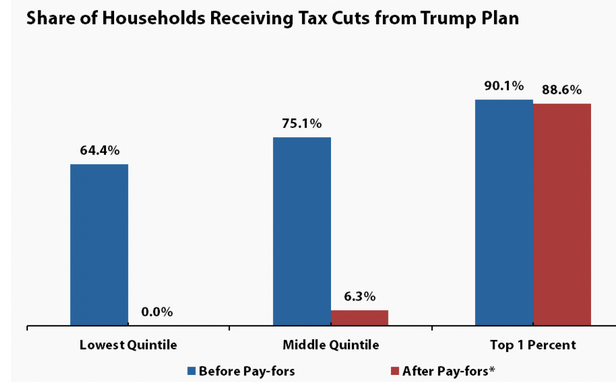
Thankfully, analysts from the Tax Policy Center did just that with President Trump’s tax plan (as we understand it). They first asked the traditional question: How much of the tax cut goes to different income groups? We’ve seen that analysis of Trump’s plan before, and although the vast majority of the cuts go to the richest households (e.g., slightly less than half to the top 1 percent; 6 percent to the middle class), most households end up with reduced tax liabilities.
But then the TPC’ers ask a new question. Sure, you can load them onto the deficit for the time being, but, eventually, tax cuts will be paid for with either tax increases or spending cuts (or some combination of both). Republicans have already shown, in both the health-care debate and in their budget plans, that their preferred way to offset the tax cuts is by cutting spending — tax increases are verboten — on poor and moderate-income families. See their proposals to cut Medicaid or their budgets that cut low-income programs by more than a third.
I’ll get to the numbers in a moment, but this new analysis shows regressive tax cuts — cuts that disproportionately favor the wealthy — to be even more regressive than we thought. In round one, they deliver far more money to those at the top of the scale. In round two, given today’s Republicans’ spending priorities, they take far more away from those at the lower end of the scale.
The first figure below starkly portrays this double whammy. The bars on the left for each income group show the share of households with tax cuts before accounting for any offsets (spending cuts or tax increases). Though their average tax cut is $100, about two-thirds of low-income households get a tax cut under Trump’s plan.


