. . .
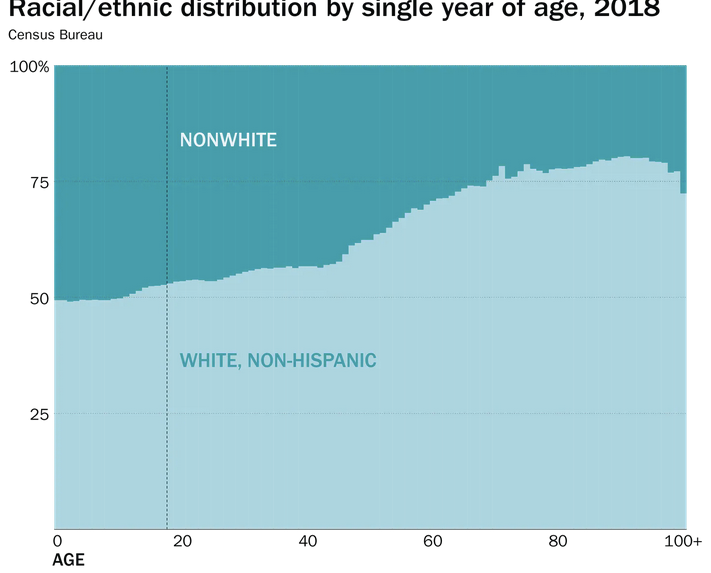
This, in a nutshell, shows the coming shift in American politics. An about-even split among those under voting age. A 55-to-45 split until we get to the mid-40s, when the density of the white population begins to increase. Among older Americans, whites outnumber nonwhites 3 to 1.
There’s variation within that nonwhite group, too. Most of those younger nonwhite Americans are Hispanic. About a quarter of the population younger than 18 is Hispanic. As we reported in July, the distribution of ages for Americans varies widely by racial and ethnic group. Among whites, the most common age is 58. Among Hispanics, it’s 11.